
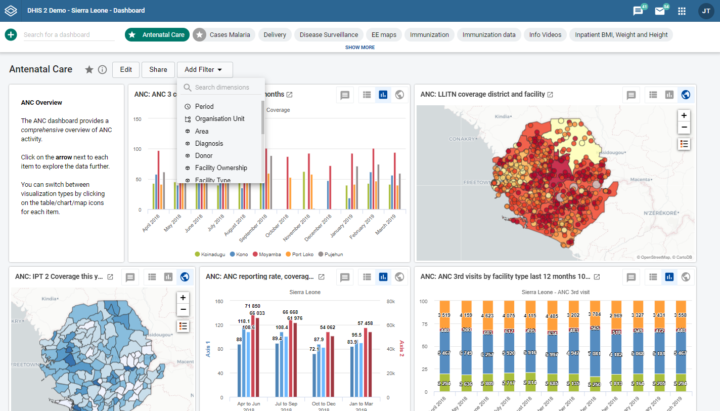
Dashboard Filter
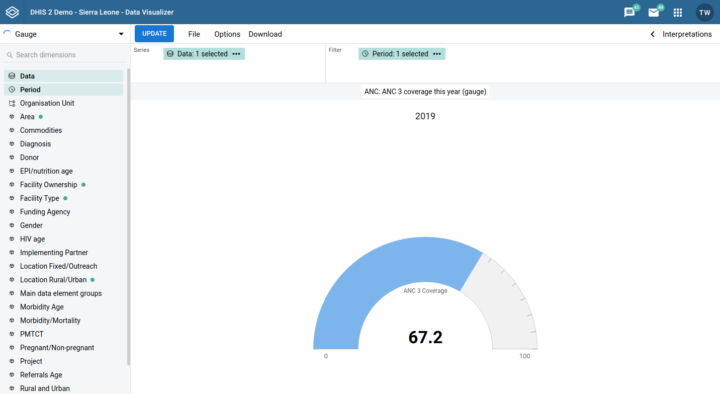
The dashboard app now provides filters which apply to entire dashboards. You can filter the dashboard content by most available dimensions. This is powerful as it combines the usefulness of filters with the ability of dashboards to see all of your most important metrics at a glance. You can click “Add filter” above the dashboard to open the list of filters. If the selected filter exists as a dimension in a dashboard item, the dimension will be replaced; otherwise the filter will be added to the dashboard item as a new filter. Try it out in the demo e.g. by selecting “Facility type” as filter.
![Screenshot 1][](https://s3-eu-west-1.amazonaws.com/content.dhis2.org/releases/screenshots/32/reporting-rates-multiple-periods-filter.png)
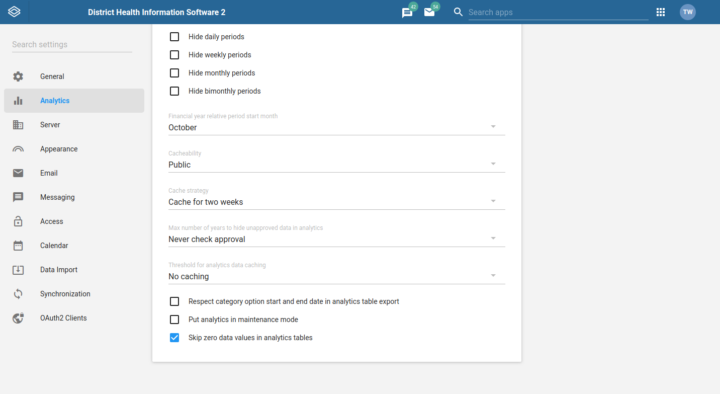
![Screenshot][](https://s3-eu-west-1.amazonaws.com/content.dhis2.org/releases/screenshots/32/setting-skip-zeros-in-analytics.png)
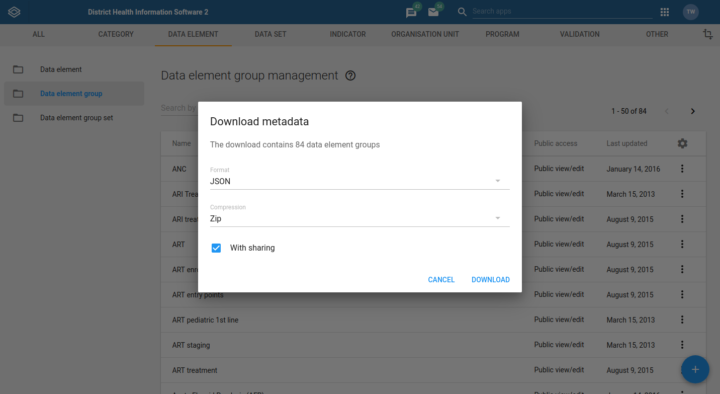
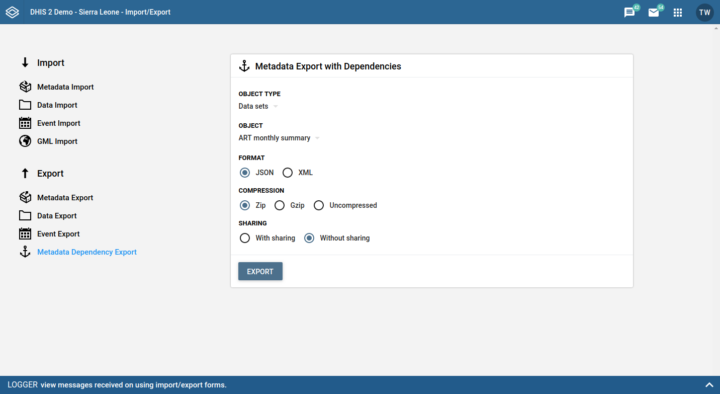
![Screenshot][](https://s3-eu-west-1.amazonaws.com/content.dhis2.org/releases/screenshots/32/metadata-dependency-export-skip-sharing.png)